
Analysing the Structure of a 30M Radio Telescope
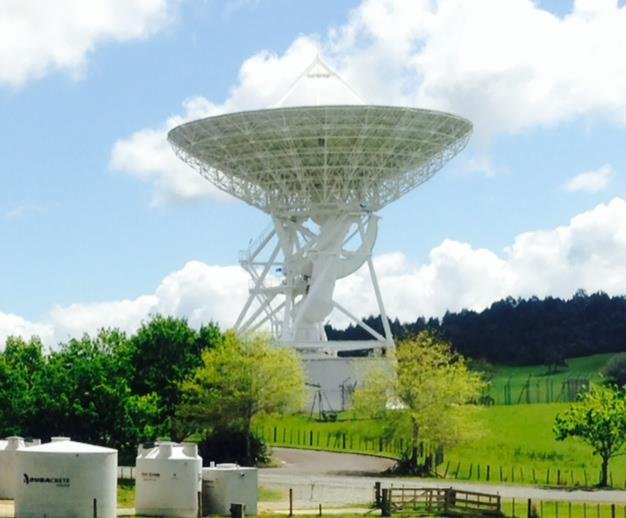
The Observatory is equipped with two radio telescopes (RT) – the only research capable RT in New Zealand - with dishes of size 12 m and 30 m in diameter. Both RT are of the Cassegrain system, using the main reflector (dish) and the sub-reflector which can be seeing on photos. Due to the larger structure of the 30 m RT, it is potentially vulnerable to gravity-induced structural deformation which varies as it operates at different elevation angles. Deviation from the ideal shape and misalignments between structural components can potentially result in partial loss of RT sensitivity. To study the surface quality of the main reflector, its alignment with the sub reflector, and the way these characteristics may vary, Recon Ltd was contracted to scan the surface of the telescope (the main and sub reflector) at different elevation angles.
Using a laser scanner for measuring surface quality is relatively new to Radio Astronomy and according to our knowledge has been used on very few occasions. Traditionally, two methods - Radio Frequency Holography and Photogrammetry - are widely used in radio astronomy. Both methods require specialised equipment, they are relatively time consuming, expensive and difficult to perform. The laser scanning method is easy and quick. Importantly, and unlike other methods, it allows scanning the main reflector and sub reflector surfaces jointly, therefore allowing to study the vital part of the RT “optics” as a whole. These advantages make the laser scanning heavily preferred over the other methods.
The FARO laser scanner is easy to carry and setup on the surface of the dish (weight ~5 kg). It has sufficient distance accuracy (± 1mm) and the operating range (from 0.6 m up to 320 m) for this research.
Scans of the 30m RT were conducted at different elevation angles - several scans were done by placing the scanner on the main reflector mounted on a pole, and a few scans were conducted from the roof of the building. Once the scanning was completed each scan was saved as a Faro Laser Scan (.fls) file in a SD Memory card inside the scanner. The scans were imported into FARO SCENE for pre-processing. Since the scanner sweeps everything within its range, detailed cleaning of the unnecessary points and point clouds was done using SCENE. The processed scans were than exported as ASCII files, which contained the XYZ data of main and the sub reflectors.
Using R (a statistical programming language), each point cloud was rotated and translated to align with a theoretical model of the main reflector. The orthogonal distances between theoretical and observed points (residuals) were calculated to estimate the surface quality. The figure above shows a contour plot of residuals for the main reflector at 10 Degrees elevation. Gravitational deformation is observed (the dark blue region) with the overall standard deviation of the surface being 1.58 mm. The data are also used to study the offset between the centres of the main and sub reflectors as the antenna operates at different elevation angles. The research is on going and the methods developed will be published on completion.
The Warkworth 30 m is amongst the largest single dish Radio Telescopes in Australasia and is a part of a VLBI Network that connects Radio Telescopes across continents to carry out international science goals such as Geodetic VLBI observations. With its current configuration, the 30 m dish will be used to support a number of current and future science projects including deep space satellite tracking, methanol maser studies in the star forming regions, pulsar searching and the Earth tectonic plate motion. No existing data on the telescope optics was previously available. The results from the laser scanning will give us the first detailed understanding of the telescope optical configuration and will enable us to devise steps to improve its performance. The results will be also of particular interests for other Radio Astronomy observatories and relevant research groups.